
Data Interpretation MCQ Questions for UGC-NET
Practice Data Interpretation multiple-choice questions with answers and explanations.
Start Topic PracticePractice Questions
Start a randomized practice session from this curriculum area.
Practice Questions
One question at a time with instant answer view.
001 DI
Comprehension5 QuestionsThe following table shows the number of students enrolled in four different Colleges (A-D) during the four years from 2020 to 2023. Based on the data in the table, answer the questions that follow.
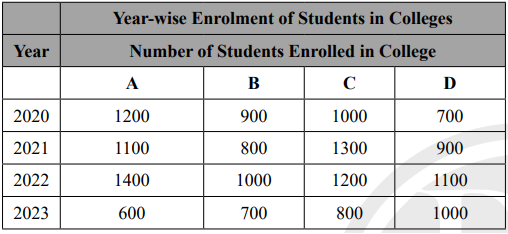
Number of students enrolled in College A in year 2020 and 2021 together is _________% more than the number of students enrolled in College C in the year 2022 and 2023 together.
001 DI
Comprehension5 QuestionsThe following table shows the number of students enrolled in four different Colleges (A-D) during the four years from 2020 to 2023. Based on the data in the table, answer the questions that follow.
If the ratio between number of girls and boys in College B in 2021 is 3 : 5 and the ratio between the number of girls and boys in College C in 2022 is 7 : 5, then what is the ratio between the number of girls in College B in 2021 to the number of boys of College C in 2022?
001 DI
Comprehension5 QuestionsThe following table shows the number of students enrolled in four different Colleges (A-D) during the four years from 2020 to 2023. Based on the data in the table, answer the questions that follow.
Taking all the Colleges together, the total number of students enrolled in the year 2020 is _______ more than the total number of students enrolled in the year 2023.
001 DI
Comprehension5 QuestionsThe following table shows the number of students enrolled in four different Colleges (A-D) during the four years from 2020 to 2023. Based on the data in the table, answer the questions that follow.
What is the average number of students enrolled in College B over all the four years?
001 DI
Comprehension5 QuestionsThe following table shows the number of students enrolled in four different Colleges (A-D) during the four years from 2020 to 2023. Based on the data in the table, answer the questions that follow.
For College B in the year 2021, if 20% of students were enrolled in B.Sc; 30% of students were enrolled in B.Com. and the remaining students were enrolled in BCA, then what is the difference between the number of students enrolled in BCA and B.Sc?